
Historic maps of Cardiff show how a small medieval market town developed into a major industrial port, railway centre and modern Welsh capital. The clearest evidence comes from maps produced between the 17th and 20th centuries, especially John Speed’s 1610 plan, John Wood’s 1830s map, Ordnance Survey surveys and detailed dockland mapping. These records reveal changes in streets, waterways, docks, railways, housing, industrial land and administrative boundaries.
- What do historic maps of Cardiff reveal about the city’s growth?
- What did Cardiff look like on John Speed’s 1610 map?
- How did Cardiff change between the 17th and 19th centuries?
- How did Cardiff’s population growth appear in historic maps?
- Which historic Cardiff maps are most useful for understanding urban growth?
- What do Ordnance Survey maps show about Cardiff’s expansion?
- How did Cardiff’s docks change the shape of the city?
- How did railways contribute to Cardiff’s growth?
- What do historic maps show about Cardiff’s suburbs?
- How can historic maps reveal lost buildings and streets in Cardiff?
- How can Cardiff historic maps be compared accurately?
- Where can people find historic maps of Cardiff today?
- Why do historic maps remain important for understanding Cardiff?
- What is the clearest timeline of Cardiff’s growth shown by historic maps?
Cardiff’s physical expansion closely followed its economic transformation. The town had a population of about 6,342 in 1801, while the population reached about 160,000 by 1901 in historical figures reproduced by the Welsh Government’s educational resources. The expansion of the Glamorganshire Canal, Bute Docks and railway network created the infrastructure that connected Cardiff with the industrial valleys of South Wales and international coal markets.
Historic maps provide a visual record of this transformation. They show where fields became streets, where canals became roads or development sites, and where docks and railway sidings reshaped Cardiff’s waterfront. They also preserve information about buildings and land uses that disappeared during later redevelopment.
What do historic maps of Cardiff reveal about the city’s growth?
Historic Cardiff maps reveal the city’s transformation from a compact medieval settlement into an industrial port and expanding urban centre, recording changes to streets, docks, railways, canals, housing, parks, industrial sites, administrative boundaries and surrounding agricultural land across several centuries.
Maps are particularly valuable because they record physical change at specific dates. A modern street map shows the present city, while an older map can reveal what occupied the same location decades or centuries earlier.
The National Library of Wales describes maps as gateways to the past and holds more than 1.5 million map sheets, charts and plans. Its collection includes material ranging from early Welsh maps to modern electronic mapping.
Cardiff’s historic maps document several major phases of development. The medieval core centred on Cardiff Castle and the River Taff. Later maps show the expansion of streets beyond the old town, the creation of industrial infrastructure, the development of docklands and the spread of suburbs.
The maps also show that Cardiff’s growth was not uniform. Development concentrated around transport routes, commercial areas, docklands and railway corridors. Agricultural land remained visible around the urban edge during periods when the central districts were already densely developed.
This makes historic maps useful for understanding both where Cardiff grew and why it grew there.
What did Cardiff look like on John Speed’s 1610 map?
John Speed’s 1610 plan presents Cardiff as a compact settlement centred on the castle, town streets and medieval urban fabric, with individual buildings, defensive features, churches and gateways identified before the later industrial expansion transformed the city and surrounding landscape.
John Speed’s map is one of the important early visual records of Cardiff. Glamorgan Archives identifies it as a full-colour plan showing individual buildings, including Cardiff Castle, the town hall, churches and former priories. It also records the old town walls, gateways and street names.
The map belongs to a period when Cardiff was substantially smaller than the industrial city that emerged in the 19th century.
Cardiff Castle formed a central landmark. The River Taff influenced the settlement’s western edge, while the historic streets formed a much tighter urban pattern than the later city.
The importance of this map is its level of urban detail. It does not simply locate Cardiff on a regional map. It records elements of the town itself.
The map therefore provides a baseline for examining later growth. Streets and buildings that appear on early maps can be compared with later Ordnance Survey sheets to identify continuity, alteration or disappearance.
The medieval street pattern also provides context for modern central Cardiff. Some present-day routes retain connections with older streets and land divisions, although later redevelopment changed the urban landscape extensively.
How did Cardiff change between the 17th and 19th centuries?
Cardiff changed from a relatively compact market town into an expanding commercial centre as transport links, canals, docks and industrial trade increased its regional importance, with the greatest physical transformation occurring during the 19th century as coal and iron exports accelerated.
The change becomes particularly visible when early maps are compared with 19th-century surveys.
Before industrial expansion, Cardiff’s surrounding landscape contained substantial agricultural land. Roads connected the town with neighbouring settlements, while waterways provided important transport routes.
The creation of the Glamorganshire Canal in 1794 transformed Cardiff’s relationship with the South Wales industrial valleys. Cadw records that the canal was constructed to transport iron from four ironworks in Merthyr to Cardiff for export. A small dock basin followed in 1798.
This infrastructure increased the importance of Cardiff as a transport and export centre.
By the 1830s, the existing dock facilities were insufficient for the scale of trade. The West Bute Dock opened in 1839, covering about 19 acres and providing approximately 9,400 feet of quays. A dock feeder canal connected the dock with the Glamorganshire Canal.
Maps produced after these developments show a much more complex landscape.
Waterways, docks, roads and new housing increasingly occupied land that earlier maps represented as fields or undeveloped areas.
How did Cardiff’s population growth appear in historic maps?
Cardiff’s population growth corresponded with major physical expansion, increasing from roughly 6,342 people in 1801 to about 26,630 in 1851 and around 172,629 by 1901, creating demand for housing, streets, transport infrastructure, commercial premises and industrial facilities.
Population statistics provide important context for interpreting historic maps.
Welsh Government educational material records Cardiff’s population at 6,342 in 1801, 26,630 in 1851 and approximately 160,000 in 1901. Historical population datasets using different administrative definitions record similar dramatic long-term growth, with 172,629 in 1901 under reconstructed modern boundaries.
The different figures reflect differences in historical boundaries and statistical methods. Historic Cardiff did not always cover the same territory as the modern local authority.
The population increase explains why maps from different periods look substantially different.
A small town requires fewer streets and buildings. A rapidly growing industrial city requires dense residential districts, warehouses, factories, transport infrastructure, schools, places of worship and commercial premises.
The change was particularly rapid during the second half of the 19th century. RCAHMW records that Cardiff expanded rapidly from the 1830s and grew at nearly 80% per decade between 1840 and 1870 in the context of coal exports and dock development.
Historic maps therefore provide the physical counterpart to demographic statistics.
Which historic Cardiff maps are most useful for understanding urban growth?
The most useful Cardiff maps include John Speed’s 1610 plan, John Wood’s late-1830s map, the 1869 Cardiff and Penarth map, 19th-century Ordnance Survey maps and detailed 1880s town plans, because each captures a different stage of urban expansion.
John Speed’s 1610 plan establishes the medieval urban baseline.
John Wood’s map of Cardiff from the late 1830s provides evidence from the beginning of the major industrial transformation. Glamorgan Archives describes it as an excellent view of Cardiff’s development.
The 1869 map by T. Waring covers Cardiff, Penarth, Roath, Canton and Llandaff. It records docks, railways and canals, making it particularly useful for understanding the growing relationship between Cardiff and its surrounding districts.
The Ordnance Survey town plan of Cardiff from 1880 provides a much more detailed view. The National Library of Wales identifies the Cardiff 1880 plan as one of its Ordnance Survey town plans.
The 1880s also produced specialised commercial maps. A Cardiff insurance plan surveyed in 1887 recorded buildings, streets and commercial premises at a scale of 1:480.
Together, these maps create a chronological sequence rather than a single snapshot.
What do Ordnance Survey maps show about Cardiff’s expansion?
Ordnance Survey maps show Cardiff’s expansion at increasingly detailed scales, recording buildings, roads, railways, industrial premises, waterways, boundaries, gardens and other physical features that allow researchers to trace urban development across individual streets and neighbourhoods.
The Ordnance Survey is Great Britain’s national mapping agency. Its historic maps form an important part of the National Library of Wales collection.
The 25-inch Ordnance Survey series used a scale of 1:2,500. The National Library of Wales states that this mapping recorded features including buildings, garden walls, hedges, paths, railway sidings, industrial yards, quarries and tramways.
Even more detailed town plans used a 1:500 scale.
Between 1855 and 1894, Ordnance Survey mapped around 400 towns with populations above 4,000 at 1:500 scale. The National Library of Wales notes that these plans sometimes recorded public houses, commercial and industrial uses, individual rooms, lamp posts and manholes.
For Cardiff, this level of detail allows researchers to investigate individual neighbourhoods rather than simply studying the overall city footprint.
A historic map can show whether a modern residential street occupies former farmland, whether an industrial building stood on the site of a modern development, or whether an old waterway disappeared beneath later construction.
How did Cardiff’s docks change the shape of the city?
Cardiff’s docks reshaped the southern part of the city by creating large areas of industrial waterfront, coal-handling infrastructure, warehouses, rail connections and dockside housing, turning the Taff and Ely waterfronts into major centres of international trade during the industrial era.
The docklands represent one of the clearest examples of Cardiff’s physical transformation.
The Glamorganshire Canal created an early connection between the industrial valleys and Cardiff. The West Bute Dock opened in 1839, followed by Bute East Dock in 1859. Roath Basin and Roath Dock opened in 1887, while Queen Alexandra Dock opened in 1907.
These developments appear clearly on successive maps.
Earlier maps show waterways and undeveloped waterfront land. Later maps show large dock basins, quays, warehouses, railway sidings and industrial premises.
The dock system also created new urban districts.
Cadw records that the 2nd Marquess of Bute built six streets of houses for workers involved in constructing the West Bute Dock. The new area was called Newtown.
This demonstrates how infrastructure projects generated secondary urban development.
Maps therefore reveal more than the docks themselves. They show the housing, roads and industrial areas created around them.
How did railways contribute to Cardiff’s growth?
Railways expanded Cardiff’s industrial reach by connecting the docks with coalfields, ironworks and surrounding towns, while railway stations, sidings, bridges and junctions occupied new land and influenced the direction of residential and commercial development.
Railway development was closely connected with the dock economy.
The Taff Vale Railway was established to connect Cardiff with the industrial valleys. RCAHMW records that the railway began at Pontypridd in 1837 and opened in 1841, initially serving the iron industry before becoming important for transporting coal to Cardiff docks.
Railway infrastructure appears repeatedly on later historic maps.
Tracks entered the docklands and connected directly with quays and industrial facilities. Bridges and viaducts carried railway lines across canals and roads.
One surviving RCAHMW record describes a railway viaduct constructed around 1858 in connection with the Rhymney Railway. It carried a tramway and later railway infrastructure towards coal hoists at Bute East Dock.
The map evidence shows how transport infrastructure created a network rather than isolated routes.
Coal moved from the valleys to Cardiff by rail. It then moved through the docks to ships and international markets.
The result was a city shaped by movement of goods, workers and capital.
What do historic maps show about Cardiff’s suburbs?
Historic maps show Cardiff’s suburbs developing outward from the historic core as population growth, transport infrastructure and industrial employment increased demand for residential land in districts including Canton, Roath, Grangetown, Riverside, Splott and surrounding communities.
Suburban development becomes increasingly visible in 19th-century mapping.
The 1869 Cardiff and Penarth map already covered Cardiff, Penarth, Roath, Canton and Llandaff, demonstrating that mapping increasingly considered Cardiff as a wider urban system rather than an isolated town.
The pattern continued as the population increased.
Residential streets appeared beyond the older central area. Railway corridors connected outer districts with industrial and commercial areas. Industrial premises appeared alongside residential neighbourhoods.
Maps also reveal differences in land use.
Some areas remained agricultural while adjacent districts contained dense streets and industrial buildings. This contrast shows that Cardiff expanded in stages rather than through one continuous wave of development.
Historic maps are therefore useful for identifying the boundaries between old urban areas and newer expansion.
How can historic maps reveal lost buildings and streets in Cardiff?
Historic maps identify buildings, streets, waterways and industrial sites that disappeared from the modern landscape, allowing researchers to compare earlier land use with present development and locate former schools, chapels, factories, docks, railway infrastructure, farms and commercial premises.
Large-scale mapping is especially valuable for this purpose.
The National Library of Wales explains that 25-inch Ordnance Survey maps can record individual buildings, garden walls, paths, wells, industrial sites and railway features.
A later map can therefore be compared with an earlier edition to identify changes.
For example, an older map can show a farmstead that later disappeared beneath housing. Another edition can show a railway siding that was subsequently removed. A canal can disappear from a later map after being filled or diverted.
Cardiff’s docklands provide several examples of this process.
RCAHMW records that Bute West Dock is now filled in and built over, while its entrance basin became the area associated with Roald Dahl Plass.
The map record preserves the earlier industrial geography even when the physical infrastructure no longer survives.
How can Cardiff historic maps be compared accurately?
Accurate map comparison requires matching dates, scales, locations and administrative boundaries before comparing streets, buildings or land uses, because Cardiff’s boundaries and mapping methods changed significantly during the period of urban expansion.
Scale is one of the most important factors.
A small-scale regional map provides an overview of roads and settlements. A 1:2,500 Ordnance Survey map provides much greater detail. A 1:500 town plan provides still finer urban information.
Date is equally important.
Comparing a 1610 map directly with a modern map without considering intermediate development hides the stages of change. A better approach uses a sequence such as 1610, the late 1830s, 1869, 1880 and later Ordnance Survey editions.
Administrative boundaries also require attention.
Historic Cardiff was not identical to the modern City and County of Cardiff. Population datasets therefore produce different historical figures depending on whether they reconstruct modern boundaries or use historical administrative units.
Researchers should also distinguish between a map showing proposed development and one recording completed development.
Historic maps sometimes included planned roads or proposed works. The National Library of Wales notes that some Welsh town plans included proposed developments in outline.
Where can people find historic maps of Cardiff today?
Historic Cardiff maps are available through major Welsh archival and mapping collections, including the National Library of Wales, Glamorgan Archives, Cardiff Library collections, Ordnance Survey resources and digital historical-map platforms that bring together multiple editions.
The National Library of Wales has extensive Welsh cartographic holdings. Its collections include historic Ordnance Survey mapping and detailed town plans.
Glamorgan Archives provides access to historic Cardiff material and identifies maps including John Speed’s 1610 plan, John Wood’s late-1830s Cardiff map and the 1869 Cardiff and Penarth map.
The National Library of Wales also holds a specific archive file containing maps of Cardiff dated 1901–1907. The collection includes a copy of the second-edition six-inch Ordnance Survey map from 1901 and maps relating to manors in the Cardiff district.
Old Maps Online provides another useful discovery tool. Its Cardiff collection includes Ordnance Survey maps from 1875, 1878, 1894, 1898 and 1915, alongside earlier mapping.
These collections allow users to trace the city through multiple historical periods.
Explore More Area Guide
Cardiff’s Lost Cinemas: Capitol, Plaza and Historic Picture Houses
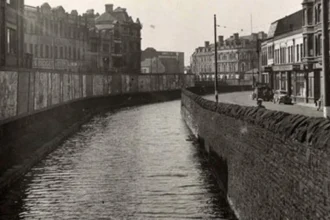
Hidden Canals Beneath Cardiff: Glamorganshire Canal History
Why do historic maps remain important for understanding Cardiff?
Historic maps remain important because they connect Cardiff’s physical landscape with its industrial, economic and demographic history, providing evidence for how transport, housing, docks, waterways, commercial districts and administrative boundaries changed across generations.
Modern Cardiff contains layers of earlier development.
A present-day road can occupy the route of an older street. A modern public space can stand where a dock basin once operated. A residential neighbourhood can cover former agricultural fields. A railway corridor can survive after the original industrial purpose disappeared.
Historic maps provide evidence for these transitions.
They also support conservation and planning. The National Library of Wales notes that historical maps are used by genealogists, environmental researchers, archaeologists and local historians.
For Cardiff, the maps are especially important because the city experienced rapid industrialisation.
The expansion of docks and railways changed the physical geography of the city. Population growth created new residential areas. Commercial activity expanded around the port. Later redevelopment changed large sections of the waterfront.
Historic mapping preserves evidence of each stage.
Digitisation is increasing access to this material. The National Library of Wales is digitising first-edition 25-inch Ordnance Survey maps and working with the Royal Commission on the Ancient and Historical Monuments of Wales to georeference historical mapping for interactive use.
This makes historic maps increasingly useful for researchers, educators, residents and visitors studying Cardiff’s past.
What is the clearest timeline of Cardiff’s growth shown by historic maps?
Cardiff’s mapped growth follows a clear sequence from a compact medieval town in 1610, through canal and dock expansion after 1794, rapid industrial and railway growth during the 19th century, detailed Ordnance Survey mapping around 1880, and continued urban expansion into the 20th century.
The 1610 Speed plan records the medieval town structure and its principal buildings.
The 1794 Glamorganshire Canal and 1798 dock basin established stronger links with the industrial valleys.
The West Bute Dock opened in 1839 as Cardiff’s export economy expanded.
The Bute East Dock opened in 1859, while railways increasingly connected Cardiff with coal and industrial districts.
The 1869 Cardiff and Penarth map demonstrates the growing geographic relationship between Cardiff and surrounding districts.
The 1880 Ordnance Survey town plan provides detailed evidence of the mature Victorian urban landscape.
Roath Dock opened in 1887, followed by further dock and railway expansion. By the early 20th century, Cardiff had developed into a major port city with a far larger urban footprint than the compact settlement recorded by early maps.
Historic maps therefore provide one of the clearest ways to understand Cardiff’s transformation. They show not only that the city grew, but precisely where the growth occurred, which infrastructure drove it, and how the landscape changed from one generation to the next.
What is the oldest historic map of Cardiff?
One of the best-known early maps of Cardiff is John Speed’s 1610 plan, which shows Cardiff Castle, churches, town streets, gateways, town walls and individual buildings within the medieval settlement.